Real-Time Data Display with ArteMon GPM

ArteMon GPM
ArteMon GPM is a PC program that displays ArteMon data in real-time. It gets its data from the GPM data publisher plug-in. This plug-in supports multiple clients, so many copies of ArteMon GPM can be running at the same time. Each copy of ArteMon GPM is individually configurable.
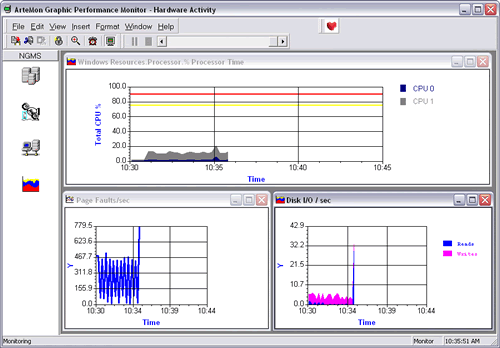
ArteMon GPM can display multiple charts on the same page. You can also have multiple pages. Access to each page is provided through the icons on the sidebar. Alternatively, the display can show the pages with tabs, much like Excel.
In its Automatic Display Mode, ArteMon GPM will cycle through selected pages, showing each for a user specified time period.
Real-Time Charts
ArteMon GPM supports the following chart types:
- Stacked Area Chart
- Line Chart
- Pie Chart
- Vertical Bar Chart
- Horizontal Bar Chart
- Status Chart
- Speedometer Chart
- Text Chart
- Statistics Chart
- Scrolling Text Chart
- Traffic Light
- Stacked Bar Chart
Warning and alarm thresholds can also be displayed on the charts.
Data Capture and Replay
ArteMon GPM can also save the data it displays on the PC. You can then "replay" this data at a later time.

