Graphics Performance Monitor (GPM)
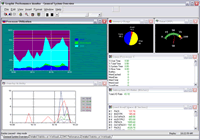
 GPM is a powerful real-time monitoring system for ClearPath MCP systems. Think of GPM as an X-Ray machine for your system. It lets you see below the surface to understand your system's performance.
Powerful Data Collection
The GPM data collection software runs on the ClearPath system. One or more GPM clients, running on Windows PCs, can display the data in real- time. The data can be stored on the ClearPath, the PC, or both.
GPM has an open, extensible architecture based on plug-in modules for collecting data. The product includes a set of standard data collection modules and add-on modules for collecting ClearPath data. You can also collect Windows server data using the GPM NT Host module. You can also create your own data collection modules.
 Real-Time Graphs
The GPM PC client can display multiple pages of real- time graphs. Twelve different types of graphs are supported, including line, area, pie, and bar charts. Threshold lines can also be shown on the charts.
With GPM PC's Automatic Display Mode, the display rotates through the various pages.
You can also use the GPM PC client to replay data from other time periods. Data can be stored on the PC in real-time. You can replay data stored on the PC or on the host.
Data Aggregation
GPM data can be aggregated into larger time intervals to support trending and forecasting. For example, CPU utilization might be sampled every 5 seconds by GPM. This generates a large amount of data, 17,280 samples per day! You can aggregate this data into larger time units so you can keep more data. By aggregating the CPU data into 15 minute periods, the samples for a day drop to 96.
Excel Based Reporting
GPM includes an Excel add-in (GPM Query) for creating reports based on your GPM data. Tables and graphs can be created from any of the GPM data items. Reports can also be generated from aggregated data. Default reports can be defined automatically based on the data you are collecting. Reports can be printed or emailed when they are generated.
Warnings and Alarms
You can define thresholds based on any of the GPM data items that cause a warning or alarm to be generated. Warnings and alarms are displayed by GPM PC.
